In the context of measuring customer loyalty, companies often ask their customers about their "likelihood of recommending" them to their friends/colleagues. The rating scale that is used with this question is from 0 to 10.
Data can be summarized in different ways. Two popular approaches are Net Scores and Mean Scores. When reporting the results of the "likelihood to recommend" question, companies companies can use the Net Promoter Score (NPS). The NPS is calculated by subtracting the percent of respondents who give a rating between 0 and 6, inclusive (called Detractors) from the percent of respondents who give a rating of 9 or 10 (called Promoters). NPS scores can range from -100 to 100.
Companies can also use the Mean Score to summarize the "likelihood to recommend" question. The Mean Score is calculated by summing all the responses and dividing that sum by the number of respondents. Mean Scores for the recommend question can range from 0 to 10.
I am conducting research about how customer experience (CX) and voice of customer (VoC) professionals interpret Net Scores and Mean Scores.
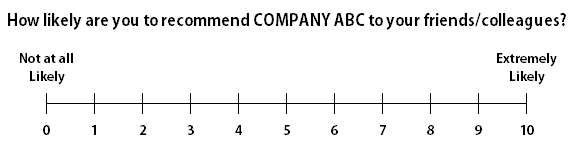
In the context of measuring customer loyalty, companies often ask their customers about their "likelihood of recommending" them to their friends/colleagues. The question and rating scale appear below.
Responses to this question are generally summarized in two different ways: Net Scores and Mean Scores.
- Net Scores: A Net Score is a difference score. The Net Promoter Score (NPS) is calculated by subtracting the percent of respondents who give a rating between 0 and 6, inclusive (they are called Detractors) from the percent of respondents who give a rating of 9 or 10 (they are called Promoters). The resulting NPS can potentially range from -100 to 100 (higher scores indicate higher loyalty).
- Mean Scores: A Mean Score is the average rating across all respondents. The Mean Score is calculated by summing the ratings of all the responses and dividing that sum by the number of respondents. The Mean Score can potentially range from 0 to 10 (higher scores indicate higher loyalty).
On the following pages, I will present different NPS and Mean Score values and ask you to make your best guess about the size of different customer segments based on the specific NPS or Mean Scores.
There are 22 questions in this survey.